Production Incident Training
That Feels Real
Practice diagnosing and fixing production failures in your browser with real commands, logs, and pressure.
Train on Kubernetes, databases, Terraform, DNS, and AI-driven production failures with terminals, live telemetry, and debriefs. No setup required.
Runs in your browser. Takes 5 minutes. Built for incident response training, team drills, and on-call practice.
When AI Breaks Production
Deploy agents, coding assistants, and automated pipelines are running in production right now. When they fail, the blast radius is larger and the failure modes are stranger. These scenarios simulate what happens when the tools meant to help become the incident.
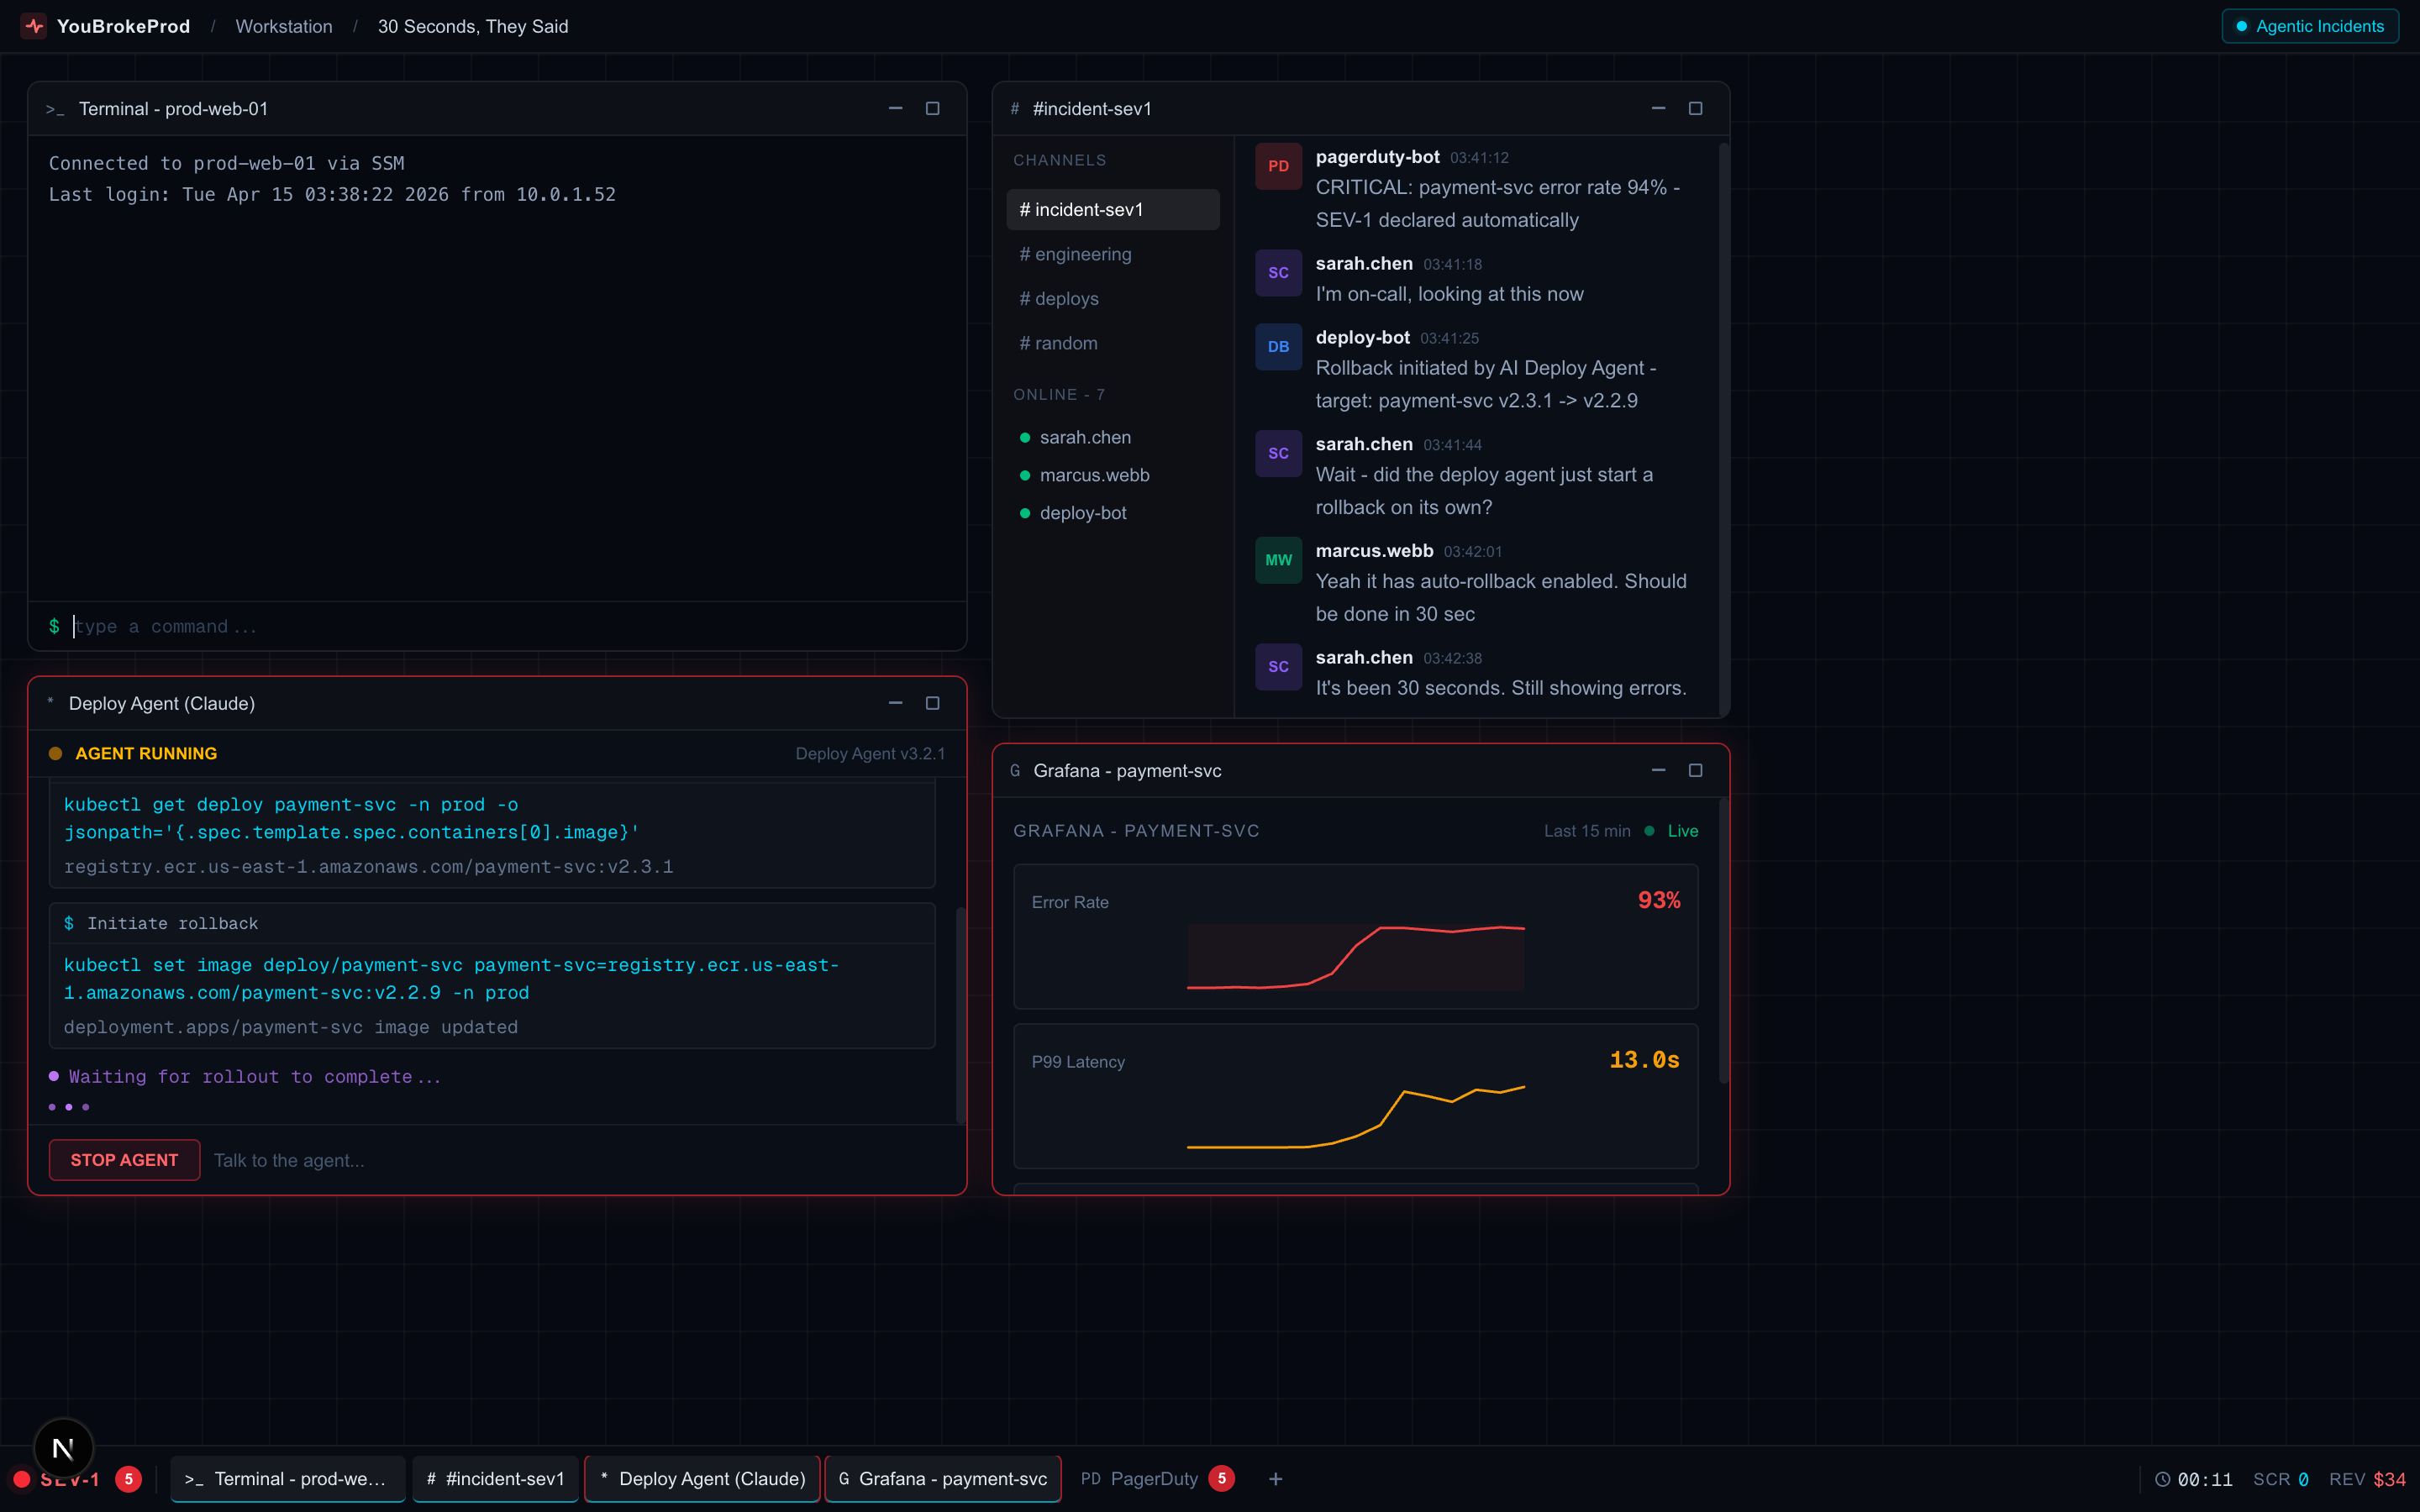
Multi-window incident workstation - Slack, Terminal, AI Agent logs, and live metrics in one view
30 Seconds, They Said
Your AI deploy agent promised a 30-second rollback. That was 12 minutes ago. Pods are in mixed state, ECR auth expired, and the agent is stuck in a retry loop.
The Fix That Wasn't
Production 500s spiking. Your AI coding assistant investigated, found a bug, and shipped a fix. Errors dropped - then came back worse. The AI fixed the wrong thing.

Kubernetes SRE Professional Pack
10 Kubernetes scenarios covering probes, OOM, DNS, rollouts, storage, RBAC, and multi-layer failures.
From CrashLoopBackOff to CoreDNS negative cache poisoning. Each scenario drops you into a realistic EKS-style console with real kubectl commands, live pod events, and a ticking clock. Built for SREs who want hands-on Kubernetes debugging practice across the full range of failure modes - not just the obvious ones.

An AI agent ran terraform destroy on production.
2.5 years of data - gone. Can you recover it?
Based on the real DataTalksClub incident that hit the front page of Hacker News. Play through an authentic Claude Code split-panel interface - the same kind of setup that caused the original disaster.
What the DevOps community said when this happened in real life
"Claude Code wiped our production database with a Terraform command. It took down the DataTalksClub course platform and 2.5 years of submissions."
"Just as someone posts that Claude Code deleted a production environment via Terraform, we see 'all those annoying manual approvals need to go away'"
"I call BS on anyone who says they check every little thing their agent does. This will happen more, not less."
It's Cyber Monday. Payments just stopped. You're on call.
Live 3D architecture, real-time logs, real commands, and a ticking clock. Can you fix it before the money runs out?
The Situation Room - interactive 3D war room with live architecture, real commands, and a ticking clock
War Room - train your whole team on the same incident
Create a shared incident room, bring your team in with a join code, and race through the same outage together. See who diagnosed it fastest, who got stuck, and who found the root cause first. Self-serve Teams up to 25 seats.
Not a Tutorial. Not a Quiz.
A Real-Time Incident Simulation.
22+ scenarios based on incidents that actually took down production. New ones added every 2 weeks.
Agentic Incidents
When AI tools break production
30 Seconds, They Said
Your AI deploy agent promised a 30-second rollback. That was 12 minutes ago. ECR auth expired, pods in mixed state.

The Fix That Wasn't
Your AI assistant fixed a bug. Errors dropped. Then came back 10x worse. The AI fixed the wrong thing.

The Mysterious Timeout
Random 500s and slow page loads. The on-call engineer just quit.

The Expired Certificate
3 AM. Mobile users can't connect. The website shows 'Your connection is not private'.

No Space Left on Device
The entire application stack is crashing with write errors.

The Vanishing RAM
The API server is slowly consuming all available memory. Requests are timing out.

Situation Room: DNS Failure
Checkout is completely broken. Payments can't process.

The Mobile Apocalypse
After deploying a new API version, the mobile app is crashing on launch.

Cold Start Hell
Users are reporting 504 errors when trying to resize images.

Cache Stampede Chaos
Massive slowdowns after a Redis restart. Everything is hitting the database.
Kubernetes SRE Professional Pack
10 scenarios - probes, OOM, DNS, rollouts, storage, RBAC, and multi-layer failures.Cluster Ops: The Infinite Restart Loop
Pods are crashing on every deploy. CrashLoopBackOff, missing secrets, failed rollbacks. Debug it with real kubectl before it happens at 2 AM.

The Silent Killer Probe
Pods keep restarting but never reach Ready. The liveness probe is the culprit.

The OOM That Lies
Checkout pods OOMKilled but memory looks normal. The sidecar is hiding something.

The Phantom Rollout
Deployment stuck. Old pod won't die. Users getting duplicate notifications.

The DNS That Only Works Sometimes
Some pods resolve DNS fine. Others get NXDOMAIN. Same cluster.

The 3 AM Page
Three compounding failures from one maintenance window. Expert level.

The Pods That Won't Land
All pods Pending. Three nodes, three different blocking reasons.

The Volume That Won't Let Go
Database replica down. PV stuck on a terminated spot instance.

The Service Account That Lost Its Power
Sidecar stopped updating after cluster upgrade. Stale config in prod.

CoreDNS Negative Cache Poison
DNS failing intermittently. Cached NXDOMAIN from a brief service outage.
kubectl, logs, db queries - actual commands

Streaming logs, error spikes, gauges

Revenue drops, PagerDuty fires, pressure builds

Root cause, optimal path, what you missed
Play More. Unlock More.
Every scenario you complete earns XP. Hit milestones to unlock pro scenarios for free.
Or skip the grind - Pro unlocks all scenarios instantly.
What You Get - Free
Sign up with GitHub or Google - takes 10 seconds
- ✓The viral Terraform scenario everyone is talking about (685K+ views)
- ✓10+ incidents across databases, Kubernetes, cloud, and security (growing)
- ✓Leaderboard ranking against other engineers
- ✓Score breakdown and solution walkthroughs

Your first production incident shouldn't be your worst one.
Most engineers and technical founders get paged cold with zero prior experience handling a real incident. Reading runbooks doesn't build on-call instincts. YouBrokeProd drops you into realistic incident simulations so when the real page comes in at 3 AM, you've already been there.
On-Call Skills That Actually Stick
10+ scenarios across beginner, intermediate, and advanced. New ones every 2 weeks.

Triage Database Failures Fast
Read Postgres error states, diagnose connection pool saturation, and fix replication issues without guessing.

Debug Kubernetes Under Pressure
Diagnose CrashLoopBackOff, OOMKills, and missing secrets the way you would on a real EKS cluster - kubectl and nothing else.

Spot Security Issues Before They Escalate
Recognize credential exposure patterns, suspicious traffic, and misconfigurations that lead to real breaches.
How It Works
Each scenario is a real-time simulation running in your browser. No setup. Just you, a terminal, and a production incident to solve.
Get Paged
Pick a scenario and difficulty. You get a briefing with symptoms, a simulated terminal, and a ticking clock.
Investigate
Run real commands in the terminal - check logs, query metrics, inspect configs. Built-in hints if you get stuck.
Diagnose & Fix
Submit your root cause diagnosis, then apply the fix command. Scored on speed, accuracy, and efficiency.
Debrief
See what you got right, what you missed, and the optimal diagnostic path. Compare your score on the leaderboard.
On-call training for your whole team?
Run the same incident simulation across your SRE, platform, or founding engineering team. Compare scores, identify skill gaps, reduce MTTR, and build shared muscle memory for when the real pages come in. Manager reports and team leaderboards included.
The Next Incident Won't Wait.
Will You Be Ready?
Sign up free and start your first incident simulation in under a minute.
Start Your First Simulation